PLC and control visualization

Many industrial companies are addressing the question of how and where to start modernizing their production technologies. One of the most proven variants is the transition to a new control system and the introduction of production control via visualization.
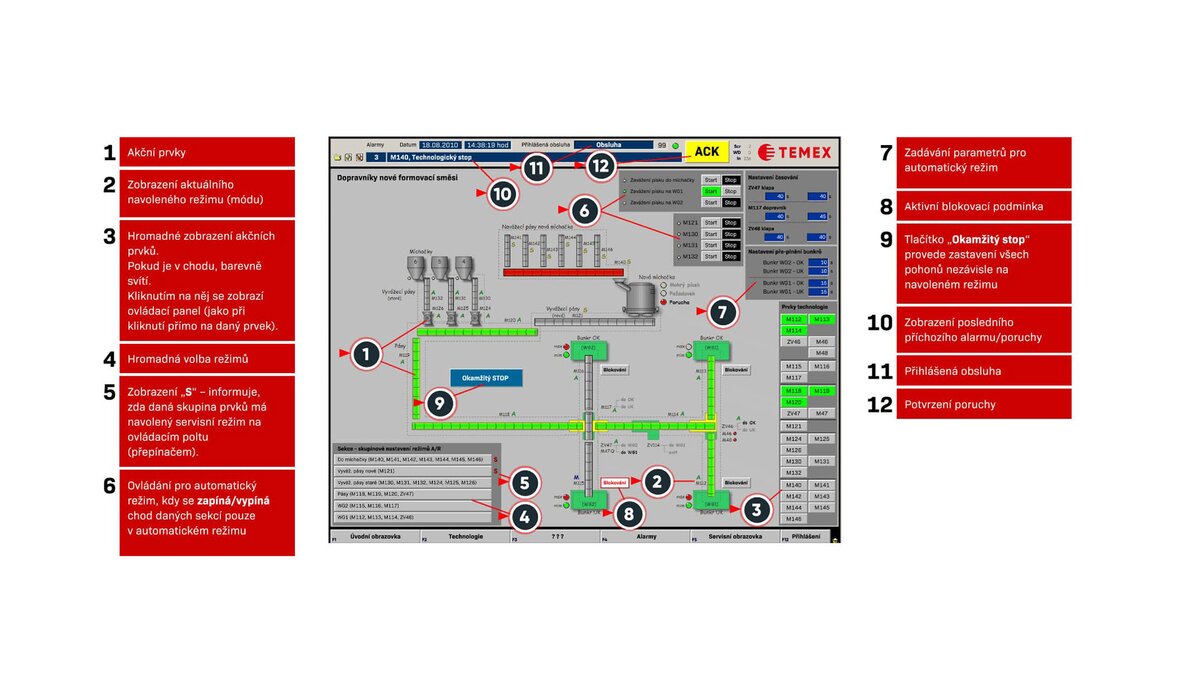
VISUALIZATION – FIRST LEVEL OF CONTROL
As part of such project, we will provide you with the conversion of the existing relay logic and basic display using segment panels to a control system with operator panels and visualization. We will replace the relay logic with a control system, e.g. SIEMENS S7-400. Indicator panels with indicators will be replaced by operator touch panels. Long bundles of control signals will be replaced by a single communication cable, at the end of which a non-central peripheral can be placed for processing signals from sensors and for controlling actuators.

The schematic overview of the technology is replaced by visualization stations with the possibility of displaying the operation of the entire technology, but also setting the operation of the technology and the control of individual parts. In the visualization service mode, it also offers control of certain actuators.
Parameters that can be set using potentiometers (rotary knobs) can now be set exactly by entering a numerical value. The status of individual actuators are displayed in color and it is possible to find out which parts are working and which have a problem.
On closer inspection, the mode of each actuator is displayed:

Click on an actuator to find out its working status:
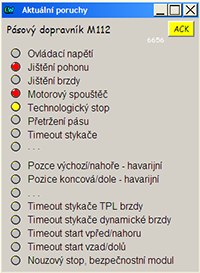
The technology allows you to control actuators individually or in entire units:


It is possible to display the status of sensors in one place:

In addition to these basic functions, actuators, sensors and alarm diagnostics of the technology have been added. Each piece of information is stored on a computer disk with its date stamp. This data are now widely used for statistical processing in MES systems. The data is archived going back several years.
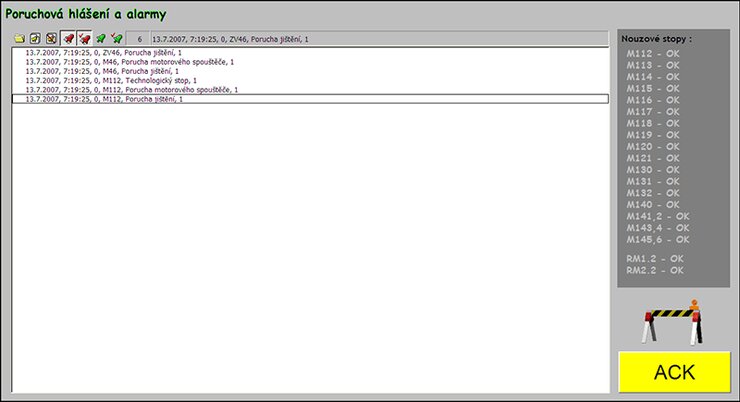
Data archives are available in basic text format and are editable in MS Excel.
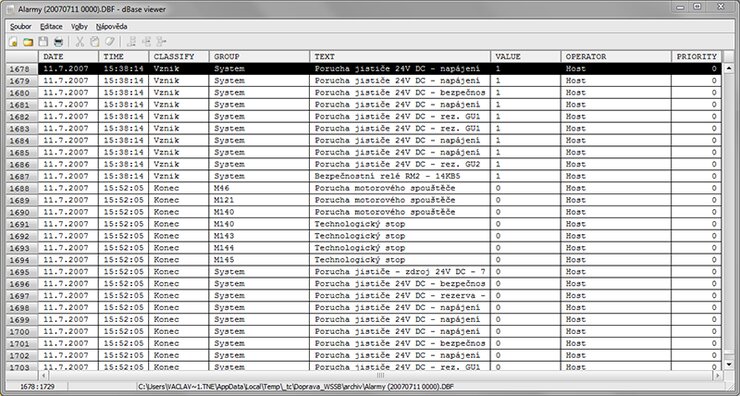
Example of data obtained from the visualization of the process:
- Line productivity
- Running time / downtime / line failures
- Error rate of technological elements (actuators, sensors)
- Sending fault information to the email / mobile phone of maintenance personnel
Why automate your production process with Temex?
- Knowledge and experience in these areas
- Complete development team for design / production / implementation / startup / warranty / service
- Possibility of controlling and monitoring the entire technology from one place
- More accessible fault diagnosis
- Creating an application according to the needs and requirements of the customer
- Providing service for the control technology and assistance in troubleshooting
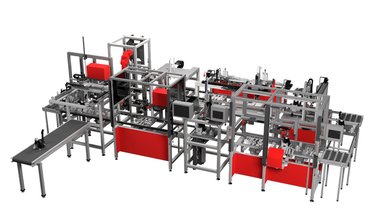
The company's management will then be able to view the overview diagram of the line via the web interface, where all the basic information about the operation of the production technology is displayed, see. interactive diagram at the beginning of the page.

