
Visualization and black box in one

Archiving process data and counting up operating hours
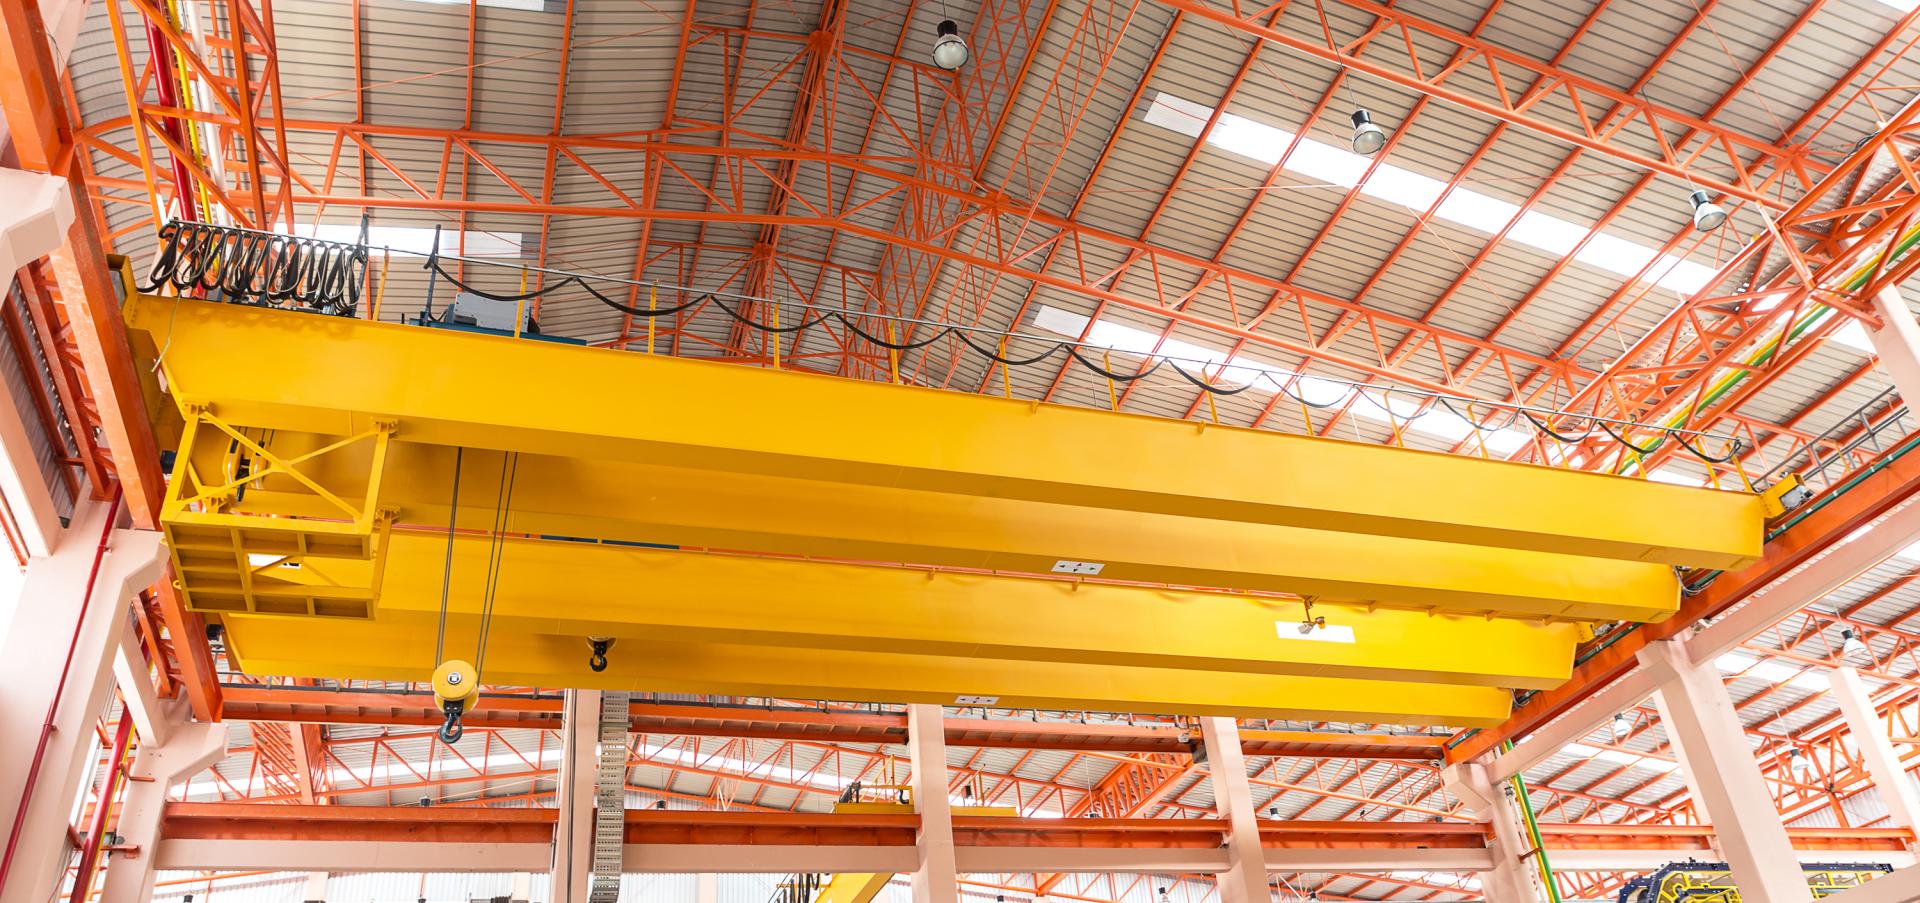
VISUALIZATION AND BLACK BOX IN ONE (FOR A METALLURGICAL CRANE)
CHARACTERISTICS
For one metallurgical crane, the task of the software is to provide:
► Backup of all process data and statuses in a so-called “black box”,
► Visualization of the processes taking place on the crane,
► Collecting warning and fault conditions and providing them remotely to the local maintenance control room,
► Calculating the operating hours of elements specified by the technologist and generation of the requirements for preventive periodic maintenance/replacement.
The framework of the entire system has become the ControlWeb visualization system, which is built on the SIMATIC S7-300F series control system and frequency converters.Remote clients located in maintenance divisions are connected to this system, which provides them with an overview of crane conditions, records of fault alerts and the progress of process variables.For the function of the black box and subsequent retrospective reconstruction of conditions prior to, say, moment “X”, all digital and analog signals are stored in archive files at one-second intervals. These signals also include the data to and from frequency converters, the position of the crab, lift heights and load weights.The data is then reconstructed in other software depending on which signals need to be analyzed and decoded.
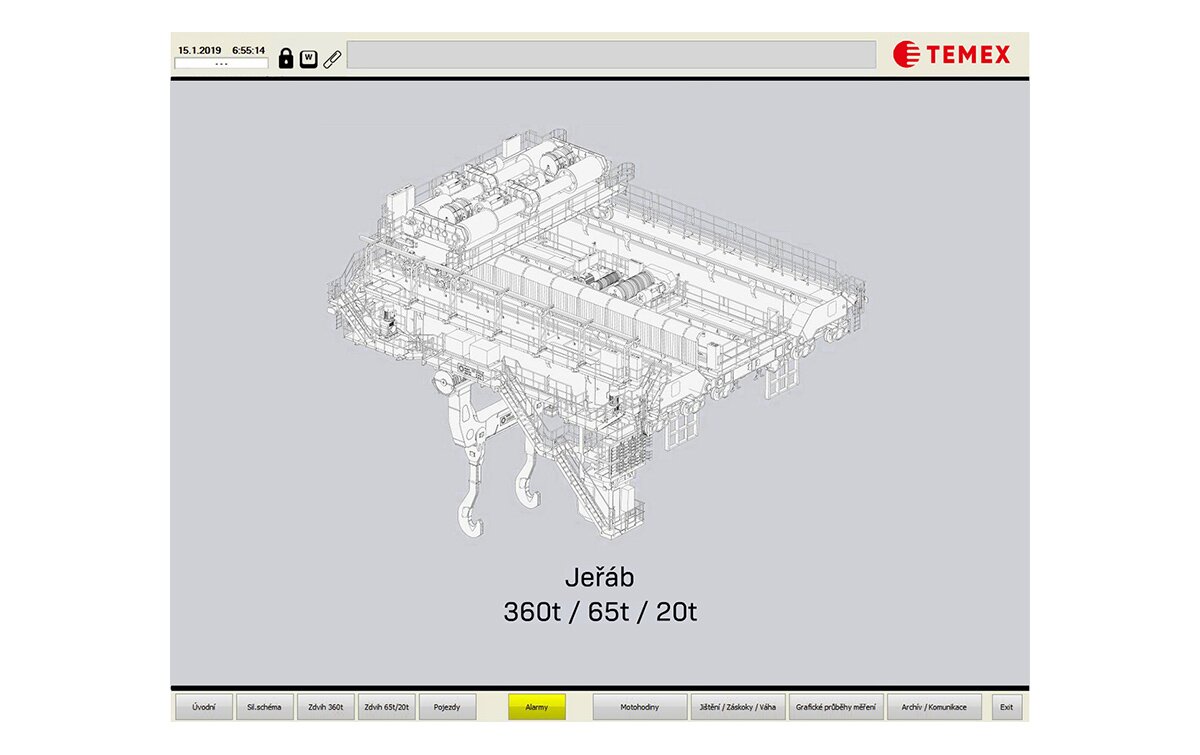
Visualization:
For the visualization of crane conditions, the screens are prepared according to sub-units so that they are clearly arranged and color-coded.
The main screen is an overview of all drive units and their system variables:
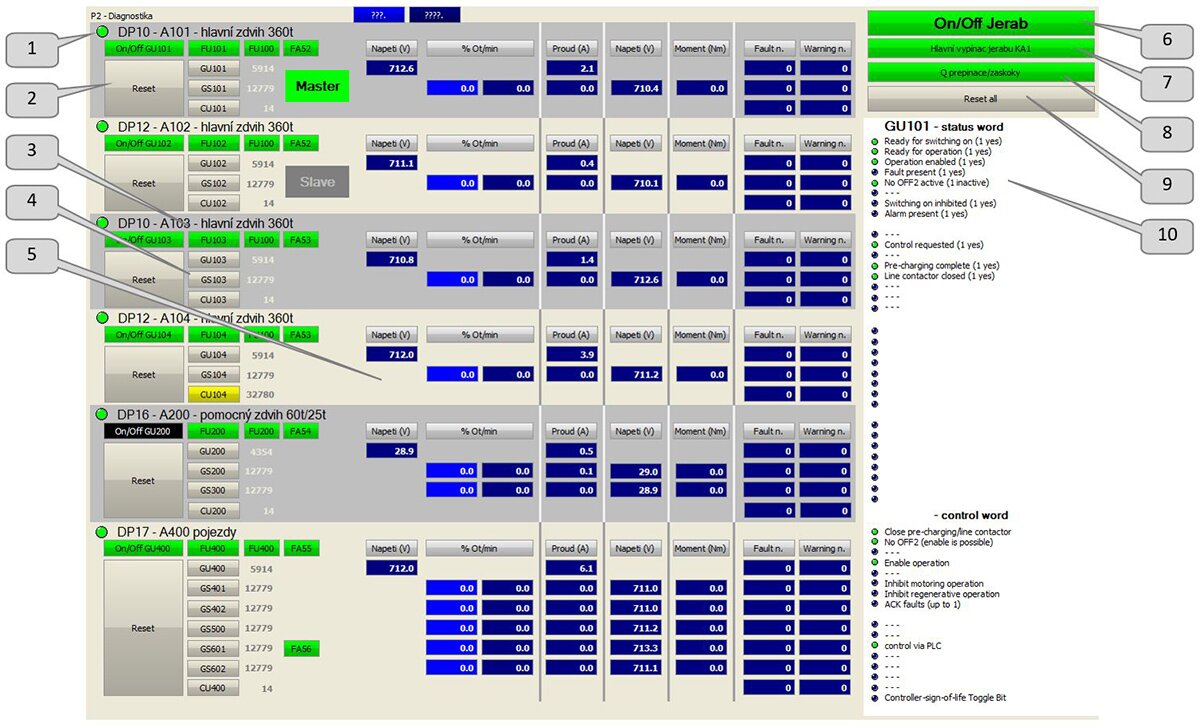
1) Dostupnost na síti PROFIBUS, 2) Reset příslušného usměrňovače a měniče, 3) Indikace stavu výkonových pojistek, 4) Kliknutím na některý s měničů se zobrazí rozpis je aktuálního stavového slova (10), 5) Zobrazované aktuální hodnoty, 6) Informace, zda je zapnutý hlavní vypínač jeřábu, 7) Informace, že je stisknuto/aktivováno tlačítko nouzového zastavení, 8) Informace, zda kombinace záskokových přepínačů je zvolena správně/špatně, 9) Reset všech usměrňovačů a měničů, 10) Detailní rozpis stavového slova předvoleného prvku.
The active screen is used for the topology of the physical connection of individual drive units:
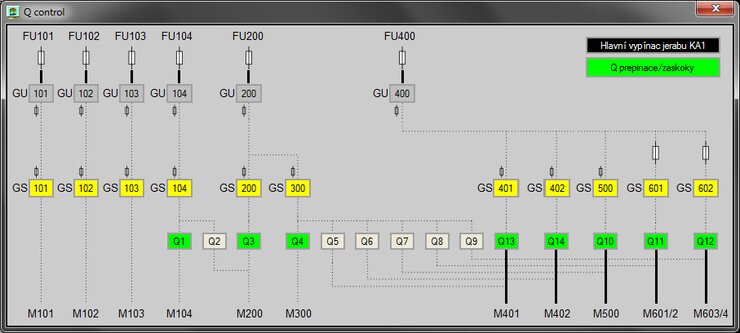
The activity here consists of coloring the conductors where the current is currently flowing, i.e. the drive is running. At the same time, the status of the “Q” interlock switches are displayed here.
The topology of the control system and communication throughout the crane are characterized by the following scheme:
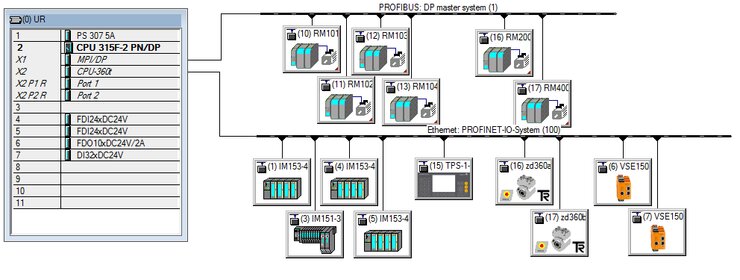
Each element in the system has its own designation, from the design by the electrical designer through the assembly and programming of control systems up to the display on visualizations. The same designation is also reflected in the fault alerts. This makes it easier for maintenance to find the problem.
The other screens show the crane sub-sections with their process states:
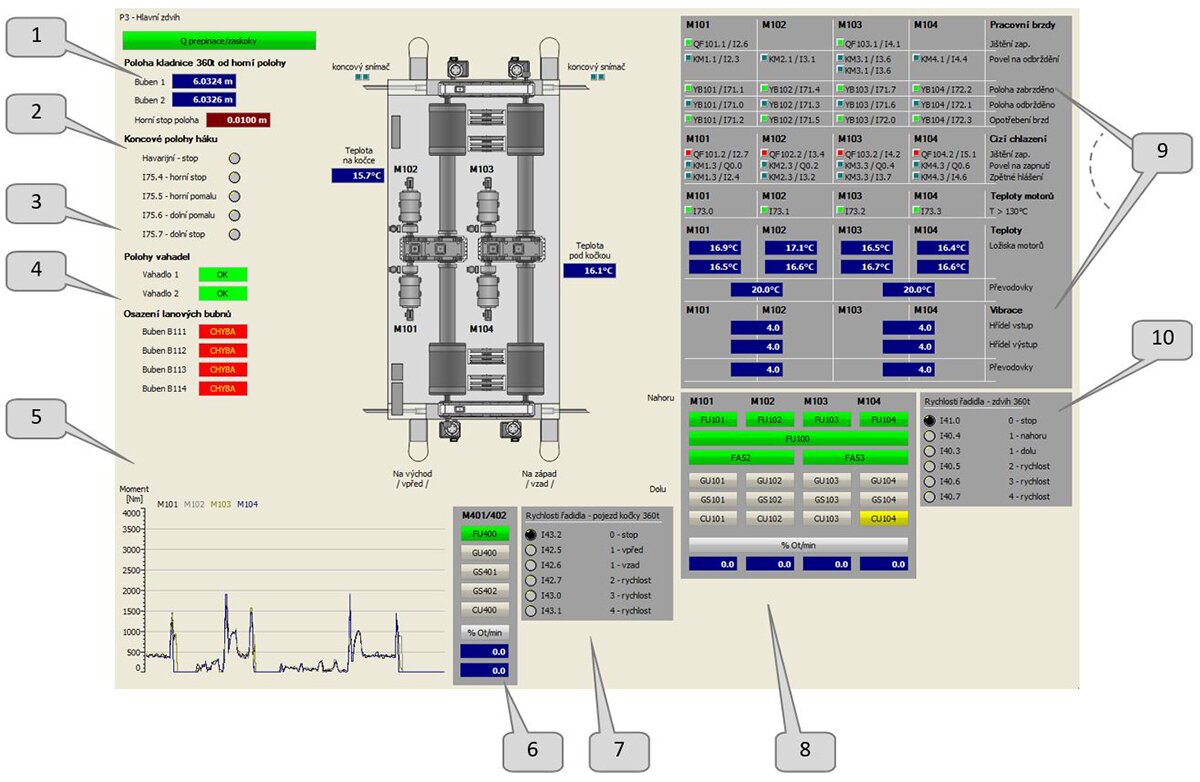
1) Informace o poloze hlavního zdvihu (redundantní systém hlídání polohy a otáček), 2) Zobrazení koncových poloh, 3) Kontrola polohy vahadel s vazbou na možnou vadu/poškození lan, 4) Kontrola polohy lanových bubnů, 5) Orientační zobrazení zatížení spřažených pohonů, 6) Informace pohonných jednotkách a aktuální rychlosti (pojezd), 7) Poloha řadidla v kabině jeřábníka (pojezd), 8) Informace pohonných jednotkách a aktuální rychlosti (zdvih), 9) Stavy snímačů, ovládacích prvků a jejich zpětné hlášení, 10) Poloha řadidla v kabině jeřábníka (pojezd).
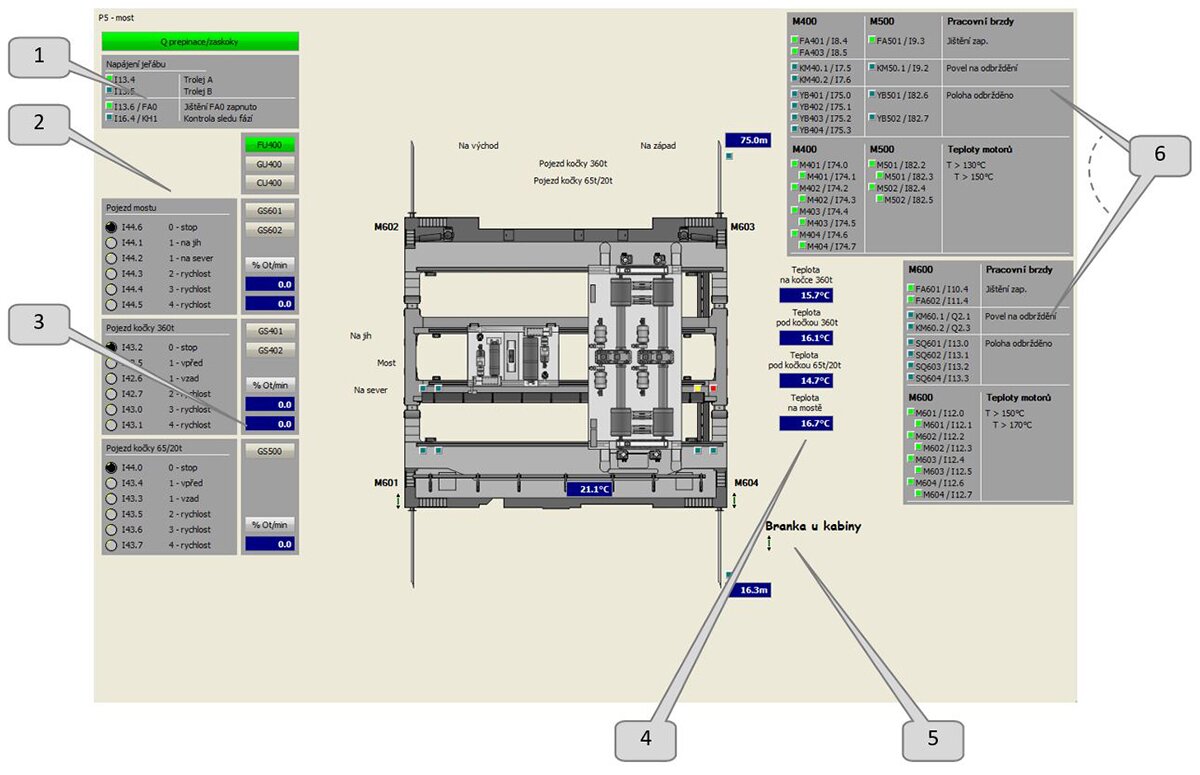
1) Informace o napájení jeřábu, volba trolejí, 2) Polohy řadidel pro zvolený pojezd, 3) Aktuální hodnoty rychlostí pojezdů a směr, 4) Informace o teplotách, 5) Informace, zda jsou vstupní branky uzavřeny, 6) Stavy snímačů, ovládacích prvků a jejich zpětné hlášení.
For faster orientation of maintenance, there is a screen with an overview showing the condition of securing elements outside the drive systems. Their color corresponds to their condition.
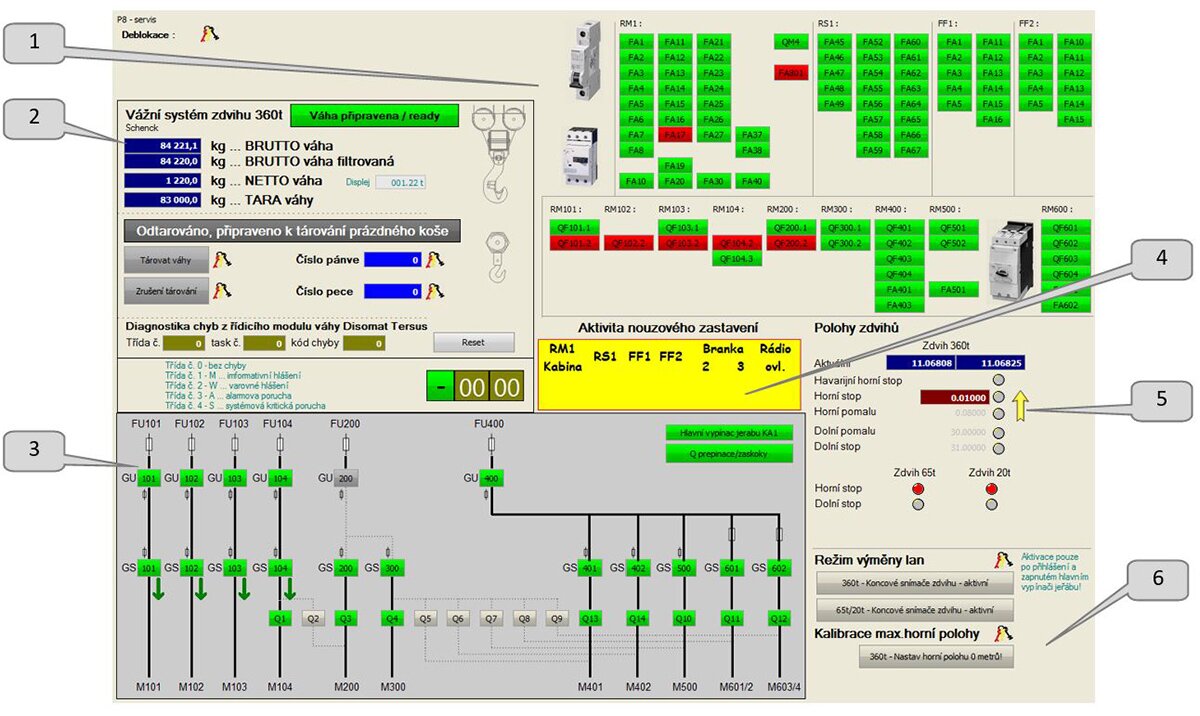
1) Informace o stavu jistících prvků, 2) Data přicházející z vážního systému, 3) Zobrazení aktuálního nastavení pohonů a stavy jednotlivých zařízení, 4) Stavy nouzových tlačítek, 5) Zobrazení informací polohy zdvihů, 6) Ovládací tlačítka pro možnost výměny lan a dealokace snímačů polohy.
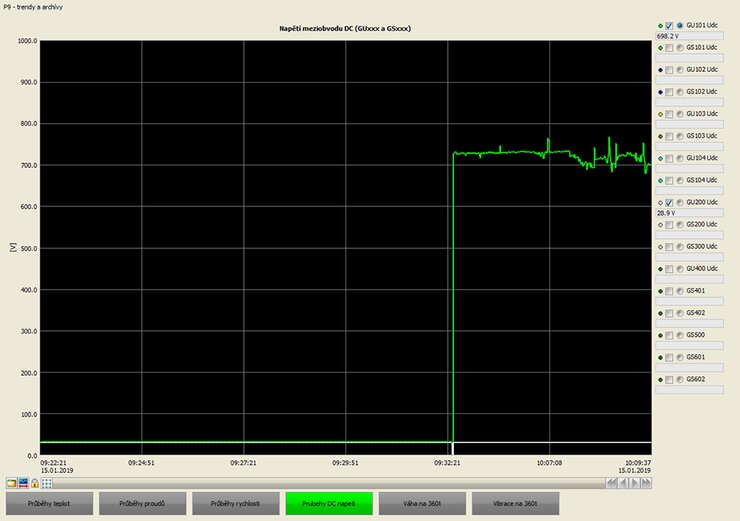
Analog process data can be displayed in relation to time:
Archived are:
• Temperature profiles, which can cause great difficulties even when cranes are idle,
• Waveforms of drive systems,
• Speed profiles of drive systems,
• DC voltage waveforms of drive units,
• Load profiles = weight of loads,
• Waveforms of the analog output of vibration sensors (after processing by internal logic).
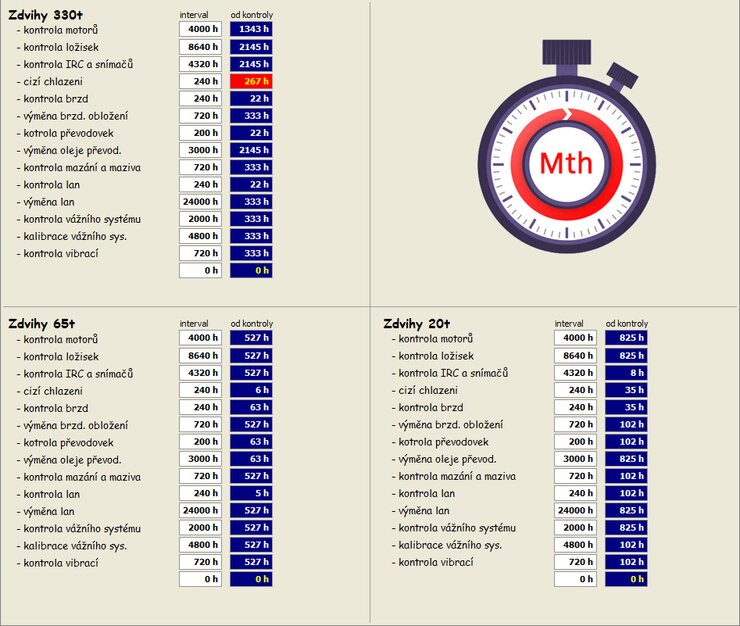
Last but not least, the operating hours and requirements for preventive maintenance/replacement of components are monitored. Their list and time period are determined by the technologist and designer:
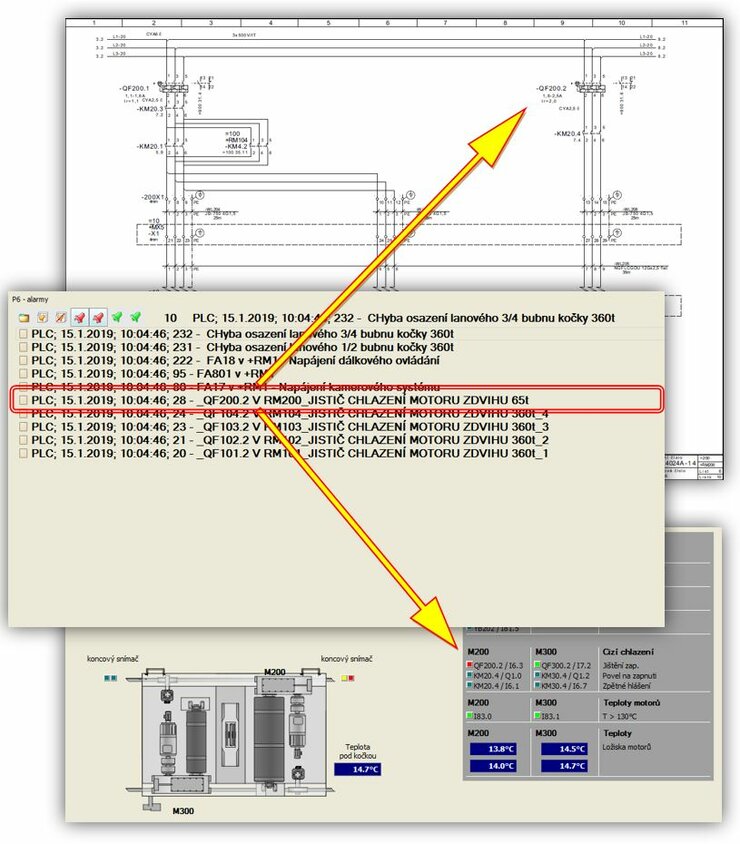
The last data stored and which has a high utility value are alarms and faults. They are only stored when they arise and disappear:
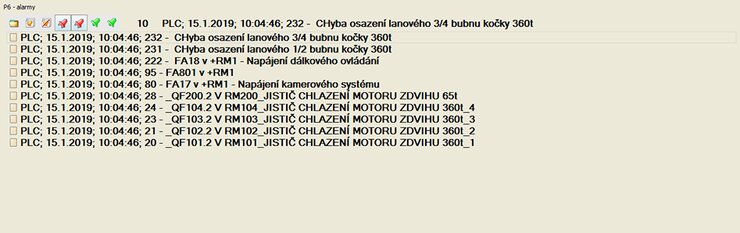
As mentioned in the introduction, this data is provided to maintenance control rooms for faster fault diagnosis and precise targeted intervention.
The entire equipment is outside the normal range (height, distance) and any incorrect analysis of the problem can lead to long downtimes. This results in large production losses.
The cranes supplied by us contain a data bridge in the form of an industrial wifi connection and the data is transferred in real time to maintenance computers. This connection allows us to provide VPN access to the programmer and drive technician 24 hours/365 days a year to our support desk.


